The balance between energy entering and leaving the atmosphere maintains the temperature on our planet. Imbalance can be caused by changes in the greenhouse effect, which in turn causes climate change.
In the pre-Industrial Revolution era, climate varied naturally. However, climate change since cannot be explained by natural causes. Rising temperatures, changing snow and rainfall patterns and more extreme climate events have been linked to unnatural carbon dioxide levels and other atmospheric GHGs. This article talks about everything related to GHG emissions, from the causes to individual countries’ contributions, the measures we must take to curb emissions and more.
What are GHS Emissions?
Compound gases that trap heat or longwave radiation in the atmosphere are called greenhouse gases or GHS. Sunlight or shortwave radiation can easily pass through these gases and the atmosphere. The Earth then absorbs this radiation and releases heat or longwave radiation. Therefore, the presence of greenhouse gases in the Earth’s atmosphere makes the planet’s surface warmer. The molecular structure of GHSs allows them to absorb the heat released or trap them in the atmosphere and re-emit them back to the Earth. This heat-trapping phenomenon is known as the greenhouse effect. The accumulation of GHGs since the industrial revolution has accelerated this greenhouse effect, causing global warming and climate change (ADEC Innovations).
Gases Responsible for GHG Emissions
The principal GHGs, also known as heat-trapping gases, are carbon dioxide, methane, nitrous oxide, and fluorinated gases.
- Carbon dioxide composes 64.3% of GHGs. It enters the atmosphere by burning fossil fuels, solid waste, trees and wood products, and specific chemical reactions. Plants remove it from the atmosphere naturally as part of the biological carbon cycle.
- Methane is released into the atmosphere by the production and transportation of coal, natural gas and oil, livestock and agricultural practices, and the decay of organic waste in municipal solid waste landfills.
- Nitrous oxide (N2O) is emitted during agricultural and industrial activities and fossil fuels and solid waste combustion.
- Fluorinated gases are synthetic gases from industrial processes. They include hydrofluorocarbons, perfluorocarbons, sulphur hexafluoride, and nitrogen trifluoride. They are sometimes known as stratospheric ozone-depleting substances or high global warming potential (GWP) gases because they can be 1,000 times more potent than carbon dioxide and can be in the atmosphere for thousands of years.
GHGs can also be classified into two types: forcing GHGs and feedback GHGs. Forcing GHGs are the four gases mentioned above: carbon dioxide (CO2), methane (CH4), nitrous oxide (N2O), and fluorinated gases. They take many years to leave the atmosphere and don’t react to temperature or air pressure changes, so they are not easily removed. Feedback GHGs are water vapour. They last in the atmosphere for only a few days and are highly active components of the climate system, meaning they respond rapidly to changes in conditions. They act as feedback to GHGs by circulating the greenhouse effect or accentuating the warming impact of forcing GHGs.
How to Evaluate GHGs?
You can evaluate greenhouse gases in three ways:
How much of the gas is in the atmosphere?
This refers to the concentration or abundance of a greenhouse gas. Some GHGs are produced in larger amounts than others. In popular discussions about climate change and GHGs, carbon dioxide tends to receive greater focus because it is the most abundant GHG in the atmosphere, accounting for roughly 75% of greenhouse gases.
How long does the gas remain in the atmosphere?
Greenhouse gases vary in lifespan and remain in the atmosphere for very different amounts. For example, carbon dioxide, methane, and nitrous oxides have a relatively short lifespan in the atmosphere, ranging from twelve to 200 years. Hydrofluorocarbons and perfluorocarbons, on the other hand, can persist in the atmosphere for hundreds to thousands of years.
How much impact does the gas have on global temperatures?
This refers to a greenhouse gas’ global warming potential (GWP) or impact on global temperatures. Some gases are more effective in absorbing energy or trapping heat than others. For instance, one pound of methane traps 21 times as much heat as one pound of carbon dioxide.
What Are the Harms of GHG Emissions?
Greenhouse gas (GHG) emissions significantly affect the environment and human health. Some of the most significant consequences include the following:
Environmental Damage

Climate change can lead to a range of ecological impacts, such as the loss of biodiversity, coral reef bleaching, and deforestation. It is important to note that coral reefs take 100,000 to 30,000,000 years to form a full-fledged colony, with growth rates varying between 0.3-2 cm/year for enormous corals to 10 cm/year for branching corals. Such drastic climate damages can, in turn, cause more harm; for example, ice sheets help maintain global temperatures at a desirable level, whereas oceans absorb more heat resulting in a rise in surface temperatures and sea levels. When sunlight hits a white surface, such as snow and ice, more of it is reflected back into space without warming its surroundings than when light hits a darker surface.
Climate Change
GHGs trap heat in the Earth’s atmosphere, leading to an increase in global temperatures. This can cause a range of impacts, including more frequent heatwaves, more severe storms and floods, droughts, and sea level rise. The devastating flood in Pakistan, heatwave and drought in Europe, and above-average wildfires in the US are some major climate change events that took place in 2022.
Health Impacts

Climate change can have a range of adverse effects on human health, including the spread of diseases like malaria, increased air pollution, and the negative impacts of extreme weather events on mental health. Climate change can affect the quality and availability of air, food, and water, which are essential for human health.
For example, air pollution, which is often caused by GHG emissions, can lead to respiratory and cardiovascular diseases, as well as cancer. Similarly, changes in temperature and precipitation patterns can affect the quality and availability of food and water, leading to malnutrition and waterborne diseases.
Economic Impacts
The consequences of climate change and environmental damage can also have significant economic impacts, including costs associated with adapting to and mitigating the effects of climate change and losses to industries such as agriculture and tourism.
What is the Paris Agreement?
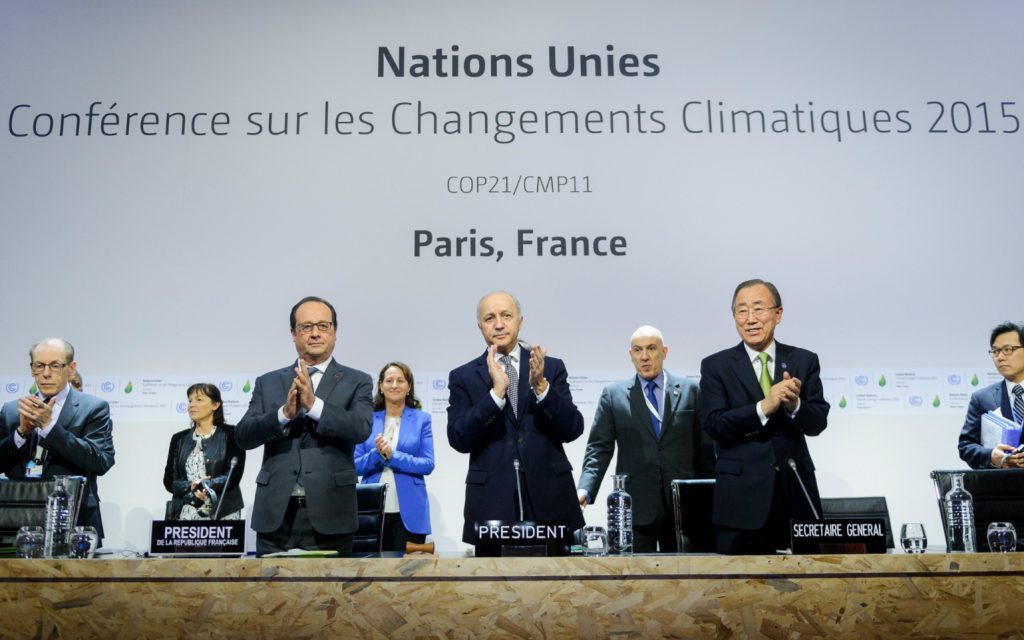
The Paris Agreement is an international treaty negotiated under the United Nations Framework Convention on Climate Change (UNFCCC). It was adopted by countries at the 21st Conference of the Parties (COP21) in Paris in 2015 and entered into force on November 4, 2016.
The Paris Agreement’s central aim is to limit global warming to well below 2 degrees Celsius above pre-industrial levels and to pursue efforts to limit the temperature increase to 1.5 degrees Celsius above pre-industrial levels. To achieve this goal, the Paris Agreement requires countries to regularly report on their greenhouse gas emissions and submit ambitious plans to reduce them. The Paris Agreement also establishes a financial mechanism to support developing countries and assist them in transitioning to low-carbon, climate-resilient economies.
Accomplishing Transformation Towards Zero Emissions
In light of the magnitude of the emissions gap, wide-ranging, large-scale, rapid and systemic transformation is now necessary to achieve the temperature goal of the Paris Agreement. To inform action, the emissions gap can be translated into sectoral shifts that bend the emissions trajectory by 2030 and lead to zero emissions in the longer term. The challenge is that multiple major transformations must be initiated simultaneously across all systems in this decade. Modifications in the way we power our homes and businesses; transport people, goods and services; grow and consume food; build our cities; and manage our lands are among the required shifts which need to take place while simultaneously improving the livelihoods of the poorest including women and minorities, and achieving the Sustainable Development Goals. In addition, shifts are needed, from phasing out fossil fuels to electrifying transport, stopping deforestation, and retrofitting buildings (Intergovernmental Panel on Climate Change [IPCC] 2021).
Sectors Responsible for GHG Emissions
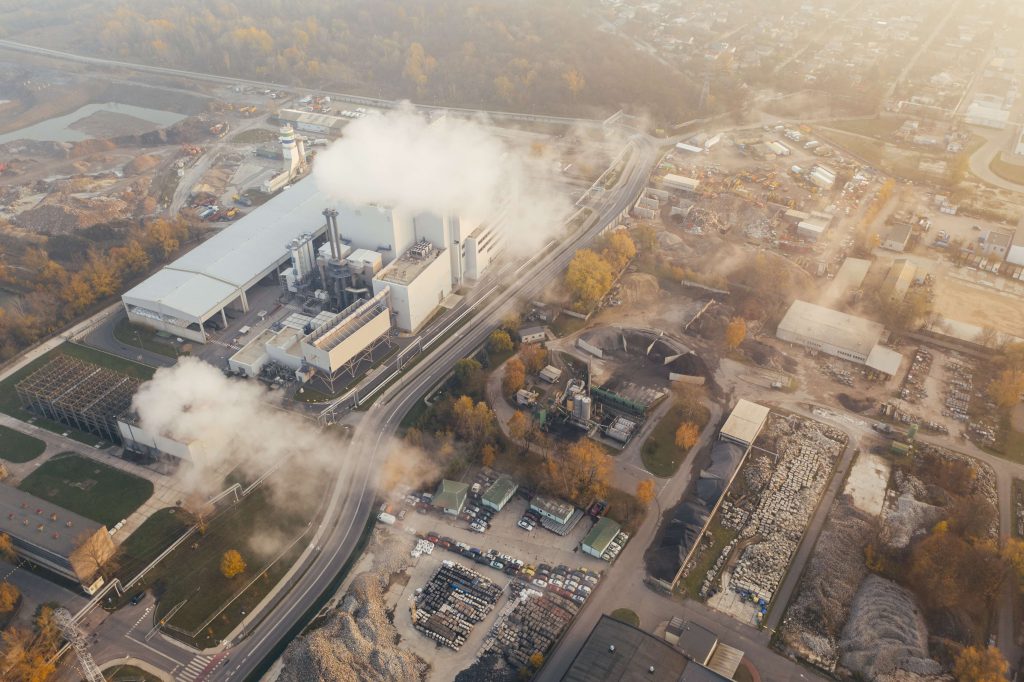
Electricity Production
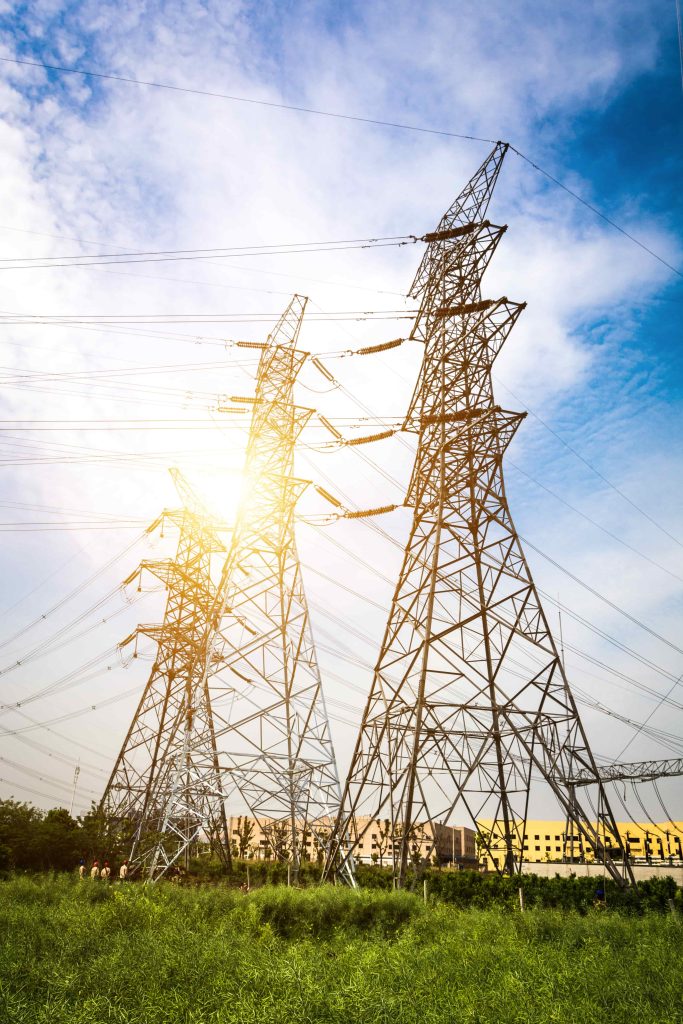
In 2021, the electricity sector was a major contributor to GHG emissions globally. According to the United Nations Environment Program, the energy supply accounted for about 37% or 20 GtCO2e of the total energy-related GHG emissions in 2020. This was largely due to the continued use of fossil fuels, such as coal and natural gas, to generate electricity. However, in recent years, there has been a trend towards the increased use of renewable energy sources, such as wind and solar, to generate electricity, which can help to reduce GHG emissions.
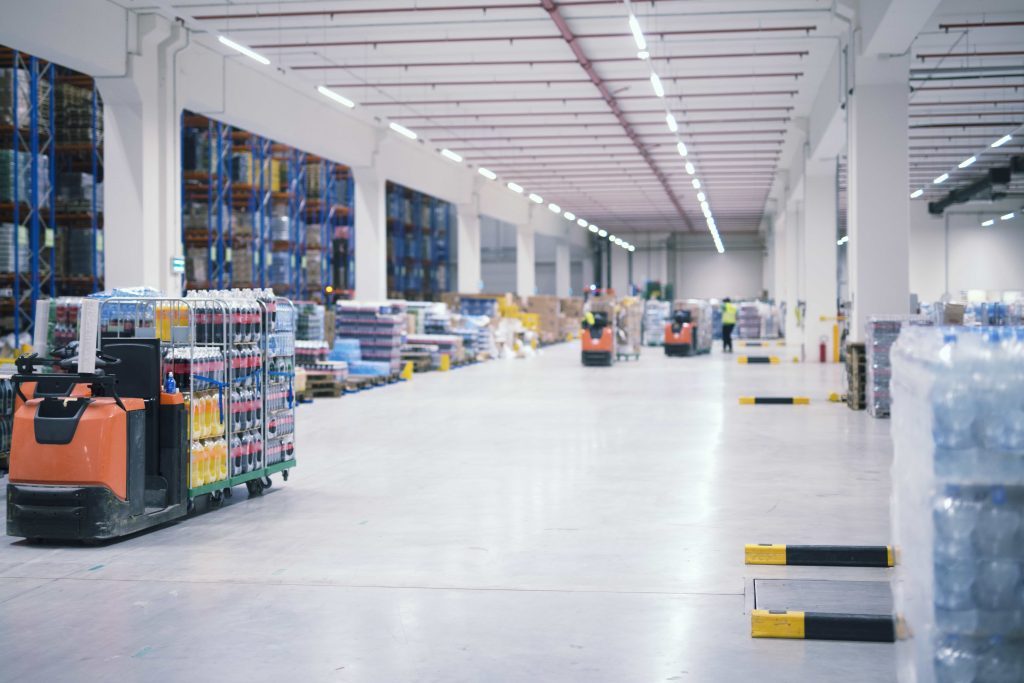
Buildings

Direct emissions through building operations are relatively small compared to other sectors and are estimated at 5.7% or 3.1GtCO2e of global greenhouse gas emissions, but this number increases to 17% when accounting for indirect emissions from electricity and heat consumption.
Reallocating the emissions associated with electricity and heat production (e.g. in the energy supply sector) to the final consuming sectors increases the contribution of the building sectors to 16%.
To decrease emissions in the building sector, four major shifts are necessary:
- Excess floor area must be minimised.
- Energy intensity must be reduced.
- The emissions intensity of energy use must decline.
- Embodied emissions from construction must be reduced.
Transportation
Transportation is the second-largest source of energy-related CO2 emissions globally, contributing 25% of total energy-related CO2 emissions. Overall, transport accounted for about 14% (7.6GtCO2e) of the total GHG emissions.
This is primarily from burning fossil fuel for cars, trucks, ships, trains, and planes. Over 90% of the fuel burned is petroleum-based, including gasoline and diesel. The largest sources of transportation-related GHG emissions include passenger cars and light-duty trucks, including sport utility vehicles, pickup trucks, and minivans.
To reduce GHG emissions from transportation, it will be necessary to establish the following measures:
- Shift to low-emitting modes of transport: including public transport, walking and cycling, which is required alongside the electrification of transport modes to align with a well-below 2°C and 1.5°C pathway.
- Accelerate the move to zero-carbon cars and trucks: Light-duty car sales are expected to reach 100% by 2035.
- Transition to zero-carbon aviation and shipping: sustainable aviation fuels are expected to meet 100% of aviation fuel needs by 2050. By 2050, zero-emission fuels are also expected to meet 84-93% maritime shipping needs. The accomplishment of the same would be considered a big success since maritime shipping not only faces a dearth of options for decarbonization outside zero-emissions fuels but also because vessels have not yet begun to use zero-emissions shipping fuels.
Industry
The industry sector, at 14 GtCO2e (26%), is the largest contributor to global emissions when direct and indirect emissions are included and the second-largest contributor when only direct emissions are considered (IPCC 2022). To date, efforts to decrease emissions have mainly focused on improved energy efficiency and the application of the best available technologies.
However, as many industrial processes have already reached maximum theoretically attainable energy efficiency, the key transformations needed to bring the industry sector to a Paris-compatible pathway include the following steps:
- Electrify industry and transform production processes: To meet the Paris agreement, the share of electricity to meet the industry demands must reach 50-55% by 2050.
- Use new fuels: reduce demand for and decrease the carbon intensity of global cement steel production.
- Use specific solutions for hard-to-abate sectors: Grow and integrate green hydrogen production capacity to help decarbonise several sectors, especially the hard-to-abate energy-intensive industry sectors that cannot use electricity.
- Accelerate material efficiency and scale up energy efficiency everywhere: Material processing and rising demands are the main drivers of industrial emissions. Basic material production leads to an increase in both direct and indirect emissions. Supply-side interventions include changing the material intensity of the product used.
- Promote circular material flow: Recycling waste materials helps to reduce emissions, but the growing complexity of product design and functionality increases the demand for materials. There are still huge gaps and regional variations in recycling. The recycling rates across various metals vary from 20-85%, and end-of-life waste from industrial materials is very low at 10%.
Agriculture
Greenhouse gas emissions from agriculture come from livestock such as cows, agriculture, soils, and rice production. Other subcategories include:
- Meat consumption for demand-side changes.
- Deforestation for the protection of natural ecosystems.
- Nitrous oxide emissions from agricultural soils for improvements in food production at the farm level.
- Energy use in food systems for decarbonizing the food supply chain.
In 2020 AFOLU (agriculture, forestry, and other land use) contributed 9.5GtCO2e (18%) to GHG emissions. And In 2021, agriculture, land use, and forestry accounted for 18.4% of GHG emissions.
In the past decade, emissions from agriculture have only slightly increased, whereas emissions from food chain supply have dramatically increased. And despite the statistics stated above, meat production was responsible for approximately 54% of GHG emissions from agriculture between 2018 and 2020 (OECD and FAO 2021).
What is LULUCF?

LULUCF stands for “Land Use, Land Use Change, and Forestry.” It refers to activities that affect land use, including the cultivation of crops, the harvesting of timber, and the conversion of land from one use to another (such as the conversion of forests to agricultural land). These activities can significantly impact GHG emissions, as land use changes can release carbon stored in vegetation and soils into the atmosphere.
Details on G20 Members' Net-Zero Pledges
- Canada: 2050
- China: 2060
- European Union: 2050
- France: 2050
- Germany: 2050
- India: Not yet announced, but aiming for a “carbon-neutral” future.
- Indonesia: Not yet announced, but aims to reduce emissions by 29% by 2030.
- Italy: 2050
- Japan: 2050
- Mexico: 2050
- Russia: Not yet announced, but aims to reduce emissions by 70-75% below 1990 levels by 2030.
- Saudi Arabia: 2050
- South Korea: 2050
- United Kingdom: 2050
- United States: Not yet announced, but President Biden has pledged to achieve net zero emissions by 2050.
Those G20 members whose emissions have already peaked are required further to accelerate their emissions declines to their net-zero target year, while those members whose emissions will continue to increase through 2030 under the NDCs (Nationally Determined Contributions) will require further policy shifts and investments (including adequate support to developing countries, where applicable) to achieve emissions reductions implied by their national net-zero targets
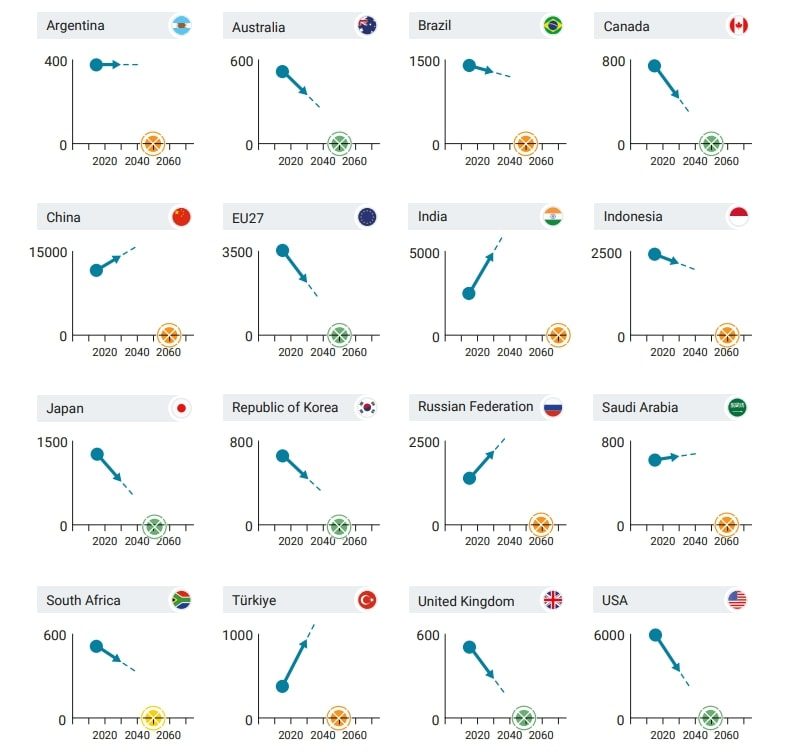
Countries’ Contributions to GHG Emissions
Different countries have different levels of GHG emissions, depending on a variety of factors, including the size of their population, their level of industrialization, and the energy sources they use.
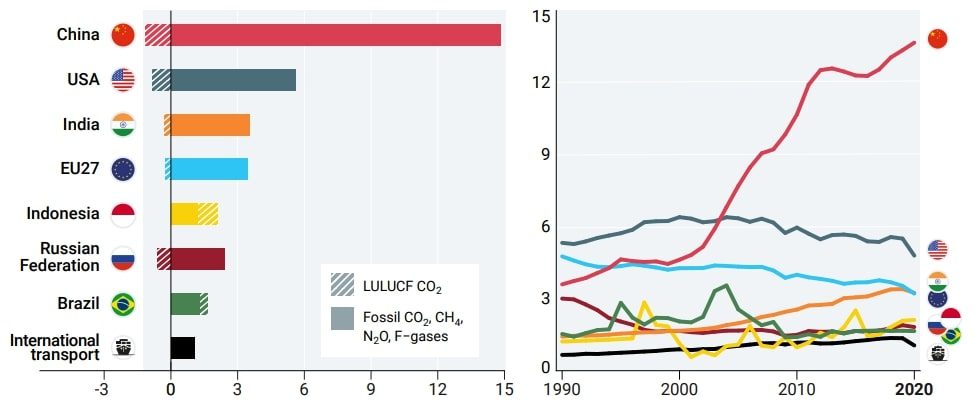
Eight major emitters – seven G20 members and international transport – contributed more than 55% of total global GHG emissions in 2020: China, the United States of America, the European Union (27), India, Indonesia, Brazil, the Russian Federation, and international transport (figure 2). The G20, as a whole, contributed 75% of the total. Collectively, the emissions of the top eight fell from 32.8 GtCO2e in 2019 to 31.5 GtCO2e in 2020 (a change of -3.8%).
In 2020, the LULUCF sector based on the national inventories (gap-filled when necessary) was a net sink in the emissions inventories of China, the European Union, India, the Russian Federation and the United States of America, and 17 G20 members overall (figure 2). If LULUCF emissions and removals are excluded, total GHG emissions are higher by as much as 33% in the Russian Federation, 17% in the United States of America, 9% in India, and about 8% in China and the European Union. By contrast, the LULUCF sector is a net emitter in Indonesia and Brazil, accounting for 44% and 22% of their total emissions. If the sector is a net emitter, the total amount of carbon dioxide released through these activities is greater than the amount absorbed. In other words, the LULUCF sector contributes to increased greenhouse gas concentrations in the atmosphere, which can contribute to climate change.
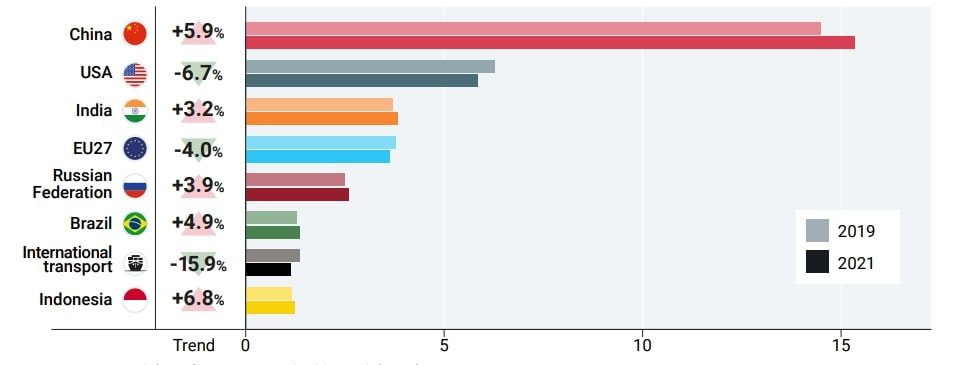
For most major emitters, including China, India, the Russian Federation, Brazil and Indonesia, GHG emissions (excluding LULUCF) rebounded in 2021, exceeding pre-pandemic 2019 levels (Crippa et al., 2022). The highest increases between 2019 and 2021 were observed in Indonesia and China, at 6.8% and 5.9%, respectively. International transport emissions in 2021 remain far below 2019 levels (-15.9%) (figure 2).
Image Description: Total and per capita GHG emissions (including LULUCF) of major emitters in 2020 and since 1990, and estimated
GHG emissions (excluding LULUCF) in 2021 compared to 2019
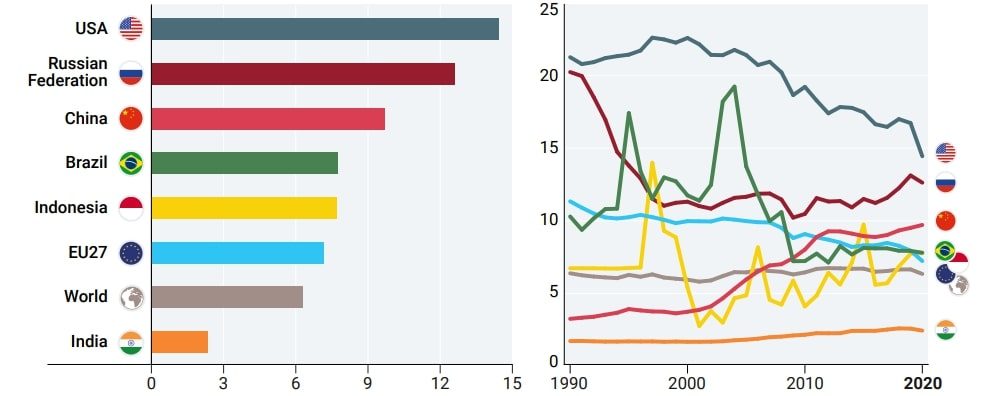
Per capita, GHG emissions of the United States of America and the European Union have continued to decline over the past decade while those of most other regions grew (figure 2). World average per capita GHG emissions (including LULUCF) were 6.3 tCO2e in 2020. The United States of America remains far above this level at 14 tCO2e, followed by 13 tCO2e in the Russian Federation, 9.7 tCO2e in China, about 7.5 tCO2e in Brazil and Indonesia, and 7.2 tCO2e in the European Union. India remains far below the world average at 2.4 tCO2e. On average, least developed countries emit 2.3 tCO2e per capita annually.
As with current per capita GHG emissions, contributions to historical cumulative CO2 emissions (excluding LULUCF) vary significantly between countries and global regions (Gütschow et al., 2016; Matthews, 2016). Whereas the United States of America and the European Union contributed 25% and 17%, respectively, to total fossil CO2 emissions from 1850 to 2019, China contributed 13%, the Russian Federation 7%, India 3%, and Indonesia and Brazil 1% each. Least developed countries contributed only 0.5% to historical CO2 fossil fuel and industry emissions between 1850 and 2019 (Dhakal et al., 2022).
Policy Measures Adopted to Curb GHG Emissions
This section gives an overview of the recent policy measures adopted by the top three Asian members of the GHG-emitting G20 members in 2021 and 2022 that are expected to affect the achievement of the NDC targets and long-term pledges.
1. China

- Renewable energy development in China has continued its strong growth. By the end of 2021, the installed solar photovoltaics (PV) and wind capacity were more than 300 gigawatts (GW). Since 1996, the annual newly installed solar PV and wind capacity have accounted for about 55% of new energy capacity.
- In April 2022, China announced that it would increase coal production by 300 million tons in 2022 through coal mining capacity increase, expanded and new products, and other measures. This comes despite China’s pledge to strictly control coal-fired power generation projects, limit the increase in coal consumption over the 14th Five-Year Plan period (2021–2025) and phase down coal consumption during the 15th Five-Year Plan period (2026–2030). Energy security concerns challenge the transformation away from coal infrastructures.
- To peak CO2 emissions and achieve carbon neutrality, China has released an Action Plan for Carbon Dioxide Peaking before 2030 and a Working Guidance for Carbon Dioxide Peaking and Carbon Neutrality. In addition, specific objectives and implementing plans are published at the regional level and across all sectors covering energy, industry, urban-rural development, transportation, carbon sink, technology development, carbon market, climate and green finance, climate adaptation and social awareness.
2. India

- In August 2022, the Cabinet approved an update of India’s NDC. The updated NDC has led to major policies being pushed forward, including 1) electric vehicles (EVs), 2) co-firing of biomass pellets in thermal power plants by 7%, 3) ethanol blending in petrol by 20%, 4) inclusion of agroforestry and private forestry, 5) solarisation of agricultural pumps, 6) clean cooking (by shifting to liquefied petroleum gas [LPG]), and 7) rooftop solar PV. The Government of India is considering coal gasification, coal conversion into chemical projects, and ammonia and hydrogen as future fuels. Energy storage is supported through a production-linked scheme to promote renewable energy.
- In recognition of the role of lifestyles, the movement Lifestyle for Environment has been proposed to foster a citizen-centric approach to combat climate change.
- The Lok Sabha passed the Energy Conservation (Amendment) Bill on 9 August 2022, aiming to facilitate the establishment and development of domestic carbon markets. The markets’ objective is to incentivize actions for emission reduction expected to result in increased investments in clean energy and energy efficiency areas, especially in the private sector.
2. Indonesia

- In February 2022, the Ministry of Environment and Forestry released Ministerial Decree No. 168/2022 on Forestry and Other Land Use (FOLU) Net Sink 2030, along with its operational plan. This regulation is expected to remove GHG emissions while implementing the energy transition and decarbonization. The FOLU Net Sink commitment was introduced in the last Long-Term Strategy to Low-Carbon and Climate Resilience 2050, published in 2021.
- The Ministry of Energy and Mineral Resources has announced a net-zero emission road map for the energy sector, which indicates that Indonesia will no longer build new fossil fuel power plants, with the exception of the 35 GW power capacity addition plan, and begin to retire subcritical coal power plants from 2030 onwards. Between 2031 and 2060, 45 GW of coal power plants will be retired and shut down. In addition, the Indonesian State-owned electricity company Perusahaan Listrik Negara seeks to cancel some coal plants under construction. However, despite the verbal statement and political decision, no regulation to phase out coal has been issued yet.
- The Electricity Supply Business Plan 2021–2030, published in October 2021, aims to achieve renewable energy capacity to account for 51.6% of total power addition until 2030. Hydropower dominates the upcoming renewable plan by around 25.6%, followed by solar (11.5%), geothermal and other renewables.
Measures to Take to Curb GHG Emissions
Phase Out Fossil Fuels and Run World With Renewable Energy
The Earth’s plants capture three trillion kilowatt hours of solar energy each day. That’s almost 20 times the energy we need just from the sunlight. So imagine if we phased out fossil fuels and ran our world on the eternal energies of nature too. Sunlight, wind, water, and geothermal.
Change Our Diet to Be Largely Plant-Based

When it comes to the land, we must radically reduce the area we use to farm so that we can make space for returning wilderness. And the quickest and most effective way to do that is for us to change our diet. It is important to know that changes don’t have to be so drastic as permanently altering the diet. Instead, you can incorporate a system of eating at least one vegetarian or vegan meal a week. The planet cannot support billions of large meat eaters. There just isn’t enough space, but if we consume a balanced diet with everything in moderation, we will be doing nature a big favour.
Restore the Ocean's Abundance by Introducing No Fishing Zones:
The ocean is our critical ally in our battle to reduce carbon in the atmosphere. The more diverse it is, the better it does that job. And, of course, the ocean is important to all of us as a source of food. Fishing is the world’s greatest wild harvest. And if we do it right, it can continue because a win-win is at play.
Halt Deforestation and Restore Forests

Forests are fundamental to our planet’s recovery. Again the two features work together. The wilder and more diverse the forests are, the more effective they are at absorbing carbon from the atmosphere. We must immediately halt deforestation everywhere and grow crops like oil palms and soya only on land that was deforested long ago.
Replant Native Trees on a Global Scale

But we can do even better than that. A century ago, more than three-quarters of Costa Rica was covered with forest. By the 1980s, uncontrolled logging had reduced this to just one quarter. The government decided to act, offering grants to landowners to replant native trees. And in just 25 years, the forest has returned to cover half of Costa Rica again. Just imagine if we achieve this on a global scale.
There is One Overriding Principle
Nature is our best ally and greatest inspiration, and we must do what nature has always done. In this world, a species can only thrive when everything around it thrives too.
Conclusion
The new data from the climate dashboard underscore what some scientists have warned: time is running out. Therefore, we must take note of how the rising GHG emissions are impacting our planet and take notice of the minute changes happening in real-time in our surroundings, for if we continue to ignore the apparent damage that GHG emissions have caused to our climate, it might be too late to undo the damage not just for us but also the upcoming generations of all living species.